

Are Registered Voter Polls Hiding a Blue Wave?
Turnout could make the difference between a blue ripple and a 2018-style landslide

This November, Democrats are hoping to match or exceed their strong performances during the 2006 and 2018 midterms. In both elections, backlash against the Republican president swept Democrats into power in Congress.
In that sense, 2026 is structurally similar—Republicans hold the White House in a midterm year—but polling tells another story. By early 2006 and 2018, Democrats already held high single-digit to double-digit national polling leads. In 2026, they’re up just 5% in our generic ballot average. Will it be a blue wave anyway?
Registered vs. likely voters
The idea behind polling is simple: estimate a population’s stance by surveying a representative sample of that population. Election polling is hard because you’re sampling a future electorate—a population that doesn’t yet exist. Some firms do this by using various questionnaires and models to identify the most likely voters. Others, especially early in a midterm year, only survey registered voters.
This creates a problem: early and late-cycle polls are sampling different populations, with early polls being especially prone to overlooking one of the most significant factors in elections: turnout. In 2014, turnout was what allowed Republicans to sweep the midterms while being behind among registered voters.
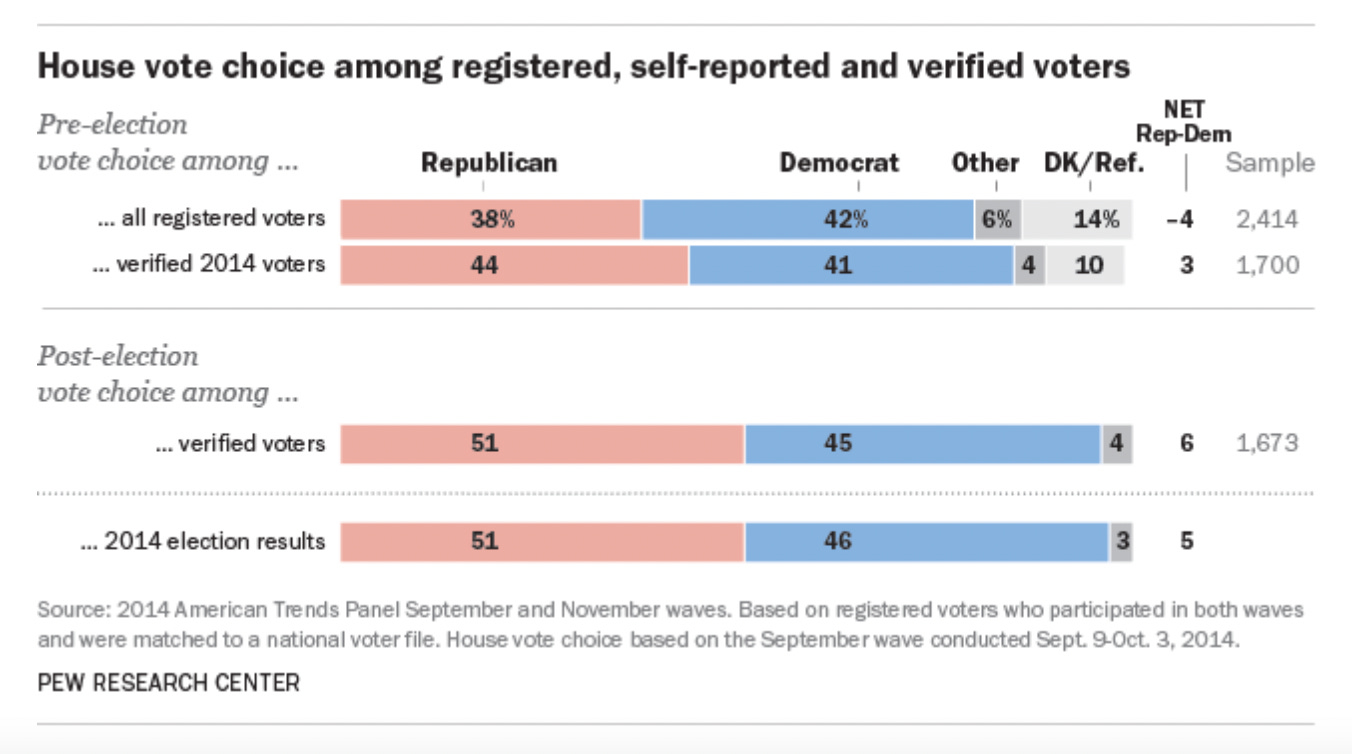
Returning to the question of 2026, Democrats are doing better with likely voters. But does that constitute hiding a blue wave? If we take polls at face value, no: the gap between likely and registered voters favors Democrats by about a point.
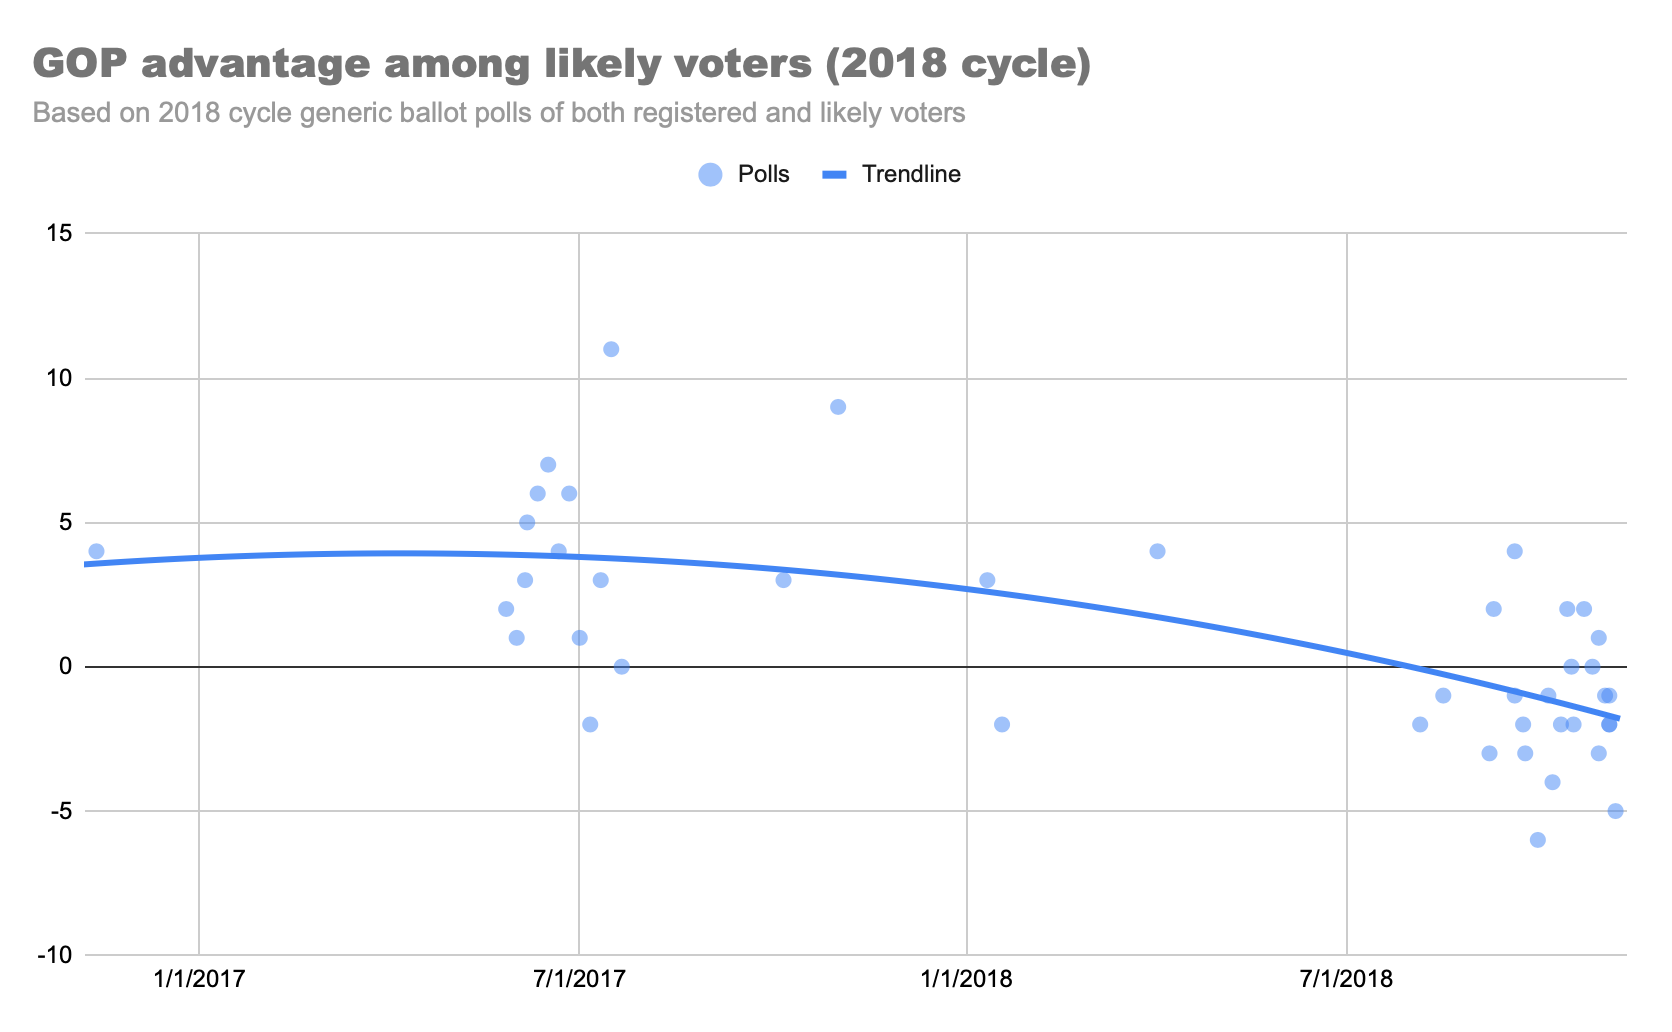
But this may not reflect the eventual electorate on Election Day, as early likely voter estimates can be highly inaccurate. Pew Research reports that likely voter gaps tend to widen “on the eve of the election,” and in 2018, early-cycle polling completely failed to capture the Democrats’ likely voter advantage.
For a more stable estimate, we can look to history. Polls comparing registered and likely voters have historically shown Republicans to do better with the latter. However, that advantage disappeared as Democrats won over college-educated Americans (who are more likely to vote).
Furthermore, likely voters moved away from whichever party held the White House during midterm years (2002 being an exception, possibly due to the rallying effect of 9/11). This alone gave Democrats slight advantages in 2006 and 2018, even with less support from educated voters.
In 2026, Democrats get to have both. Take Barack Obama’s 2008 victory: despite winning by a landslide, he carried just half of college-educated voters; Kamala Harris got nearly 70% while losing the popular vote in 2024.
What does this mean for 2026? We can make a rough estimate by entering Democrats’ past college-educated vote shares and a dummy variable representing election types into a regression. Together, these variables explain nearly 80% of the variation in likely voter effects between elections. Furthermore, they predict a 4% likely voter boost for the Democrats in 2026.
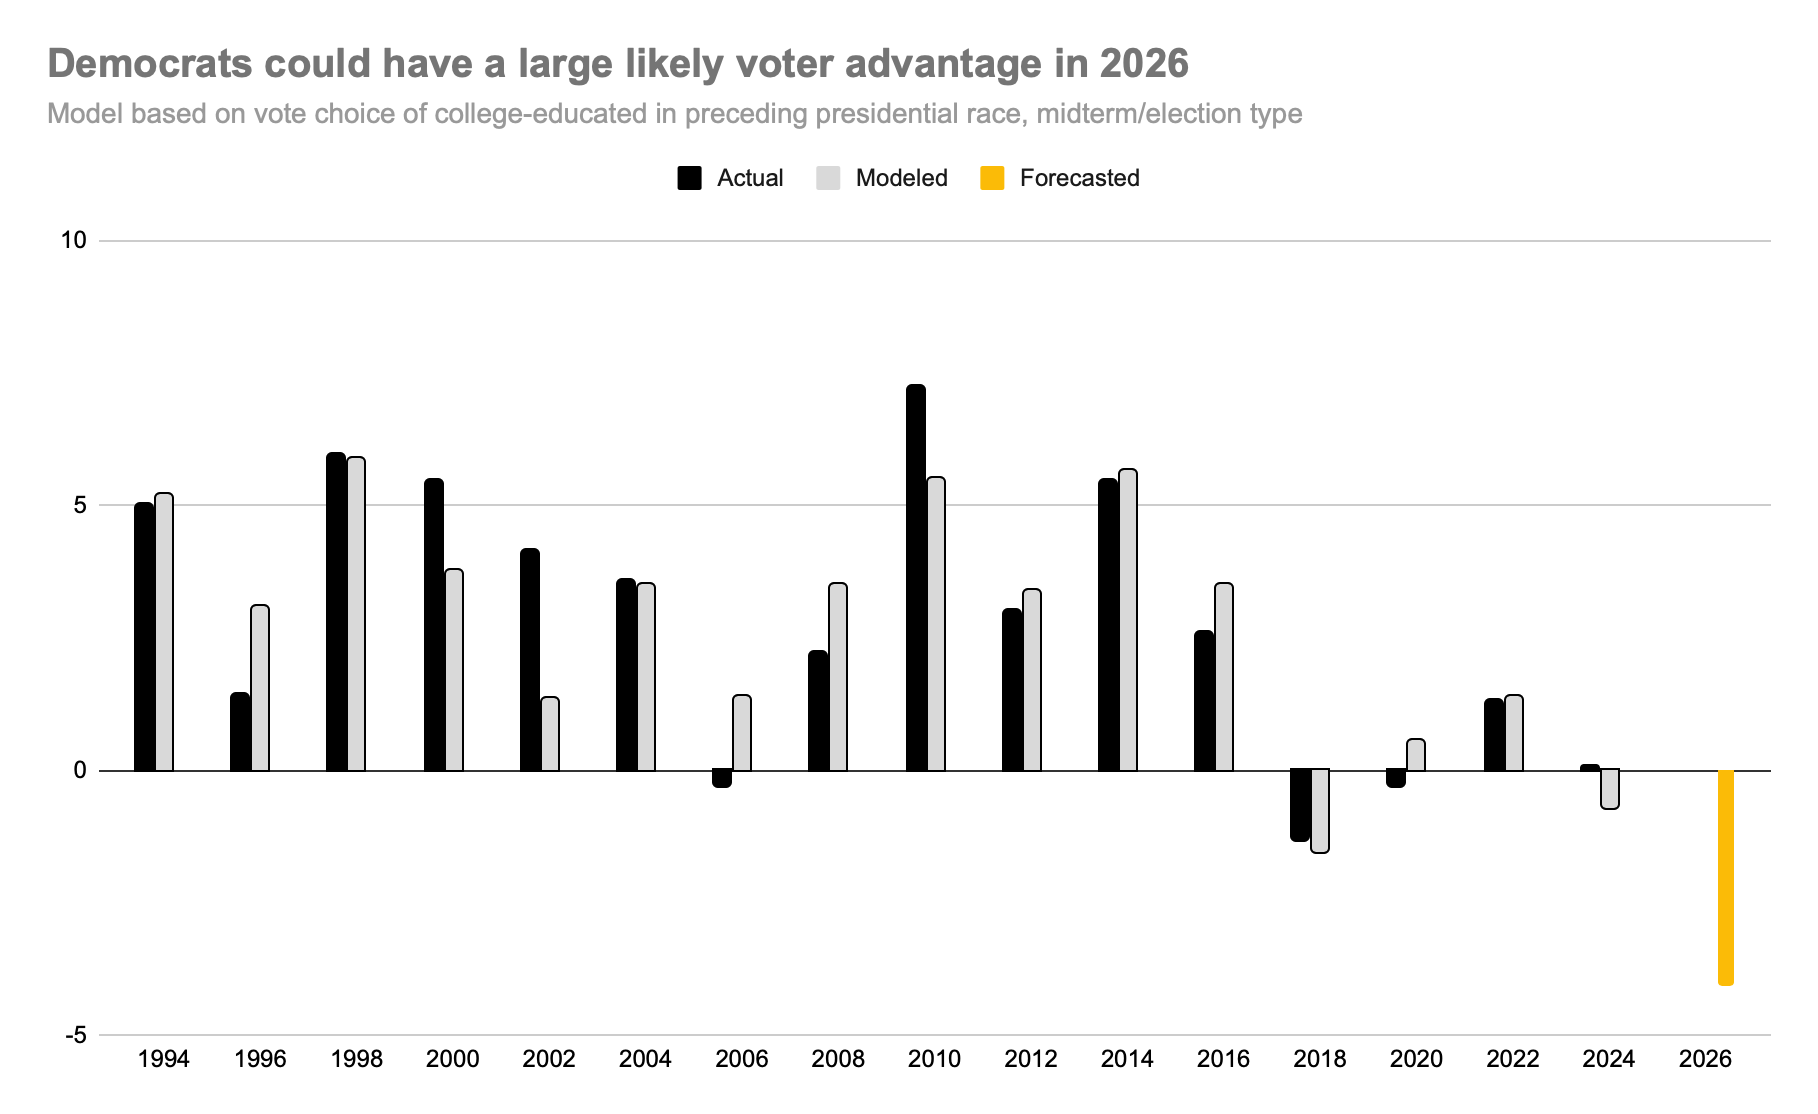
This doubles the party’s current 4% lead among registered voters (calculated by modifying our poll average to adjust towards registered voters). In other words, a national environment similar to 2018 and 2006.
This model isn’t perfect. For example, rising political engagement (and thus higher turnout) might make a large likely voter effect impossible. However, other signals—Democrats outvoting Republicans in Texas’s primaries, overperforming by double digits in special elections, and holding a historic enthusiasm gap in ABC polls—suggest that a turnout-driven blue wave is very possible.